Graph display and zoom
The graph fills the window: frequency runs left to right on a logarithmic scale from 10 Hz to 30 kHz, and EQ gain runs vertically, with the analyzer behind the curves. You can zoom into a frequency range and change the gain display scale.
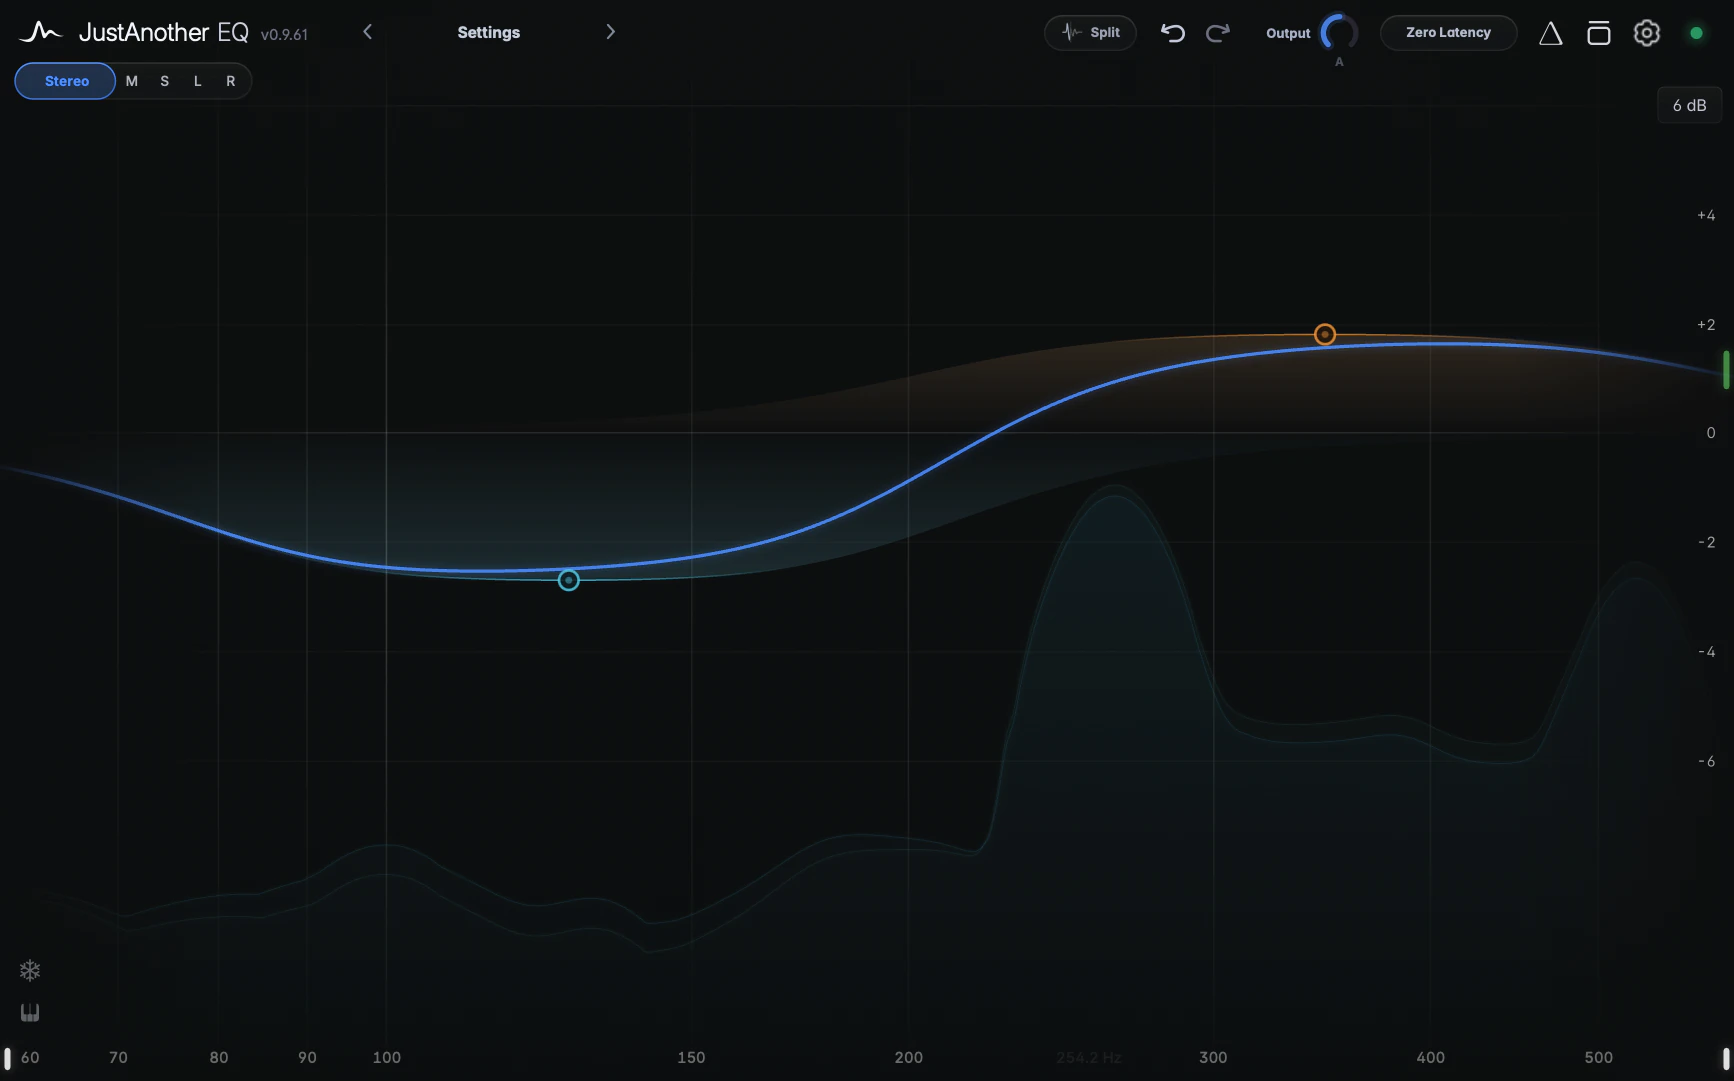
Zooming and panning
Zoom and pan on the Hz ruler, the thin strip of frequency labels along the bottom of the window:
- Drag up to zoom in and drag down to zoom out, centred on the frequency you grabbed.
- Drag sideways to pan.
- Scroll over the ruler to zoom around the pointer; scroll horizontally to pan.
- Double-click the ruler to zoom back out to the full range.
While you’re zoomed in, a small edge pill at the end of the ruler takes you further that way, and a band that’s off screen shows as a slim notch in its colour at the edge of the graph. Click the notch to jump to that band. The graph always opens at the full range.
Gain display range
The gain display range button at the top right of the graph shows the current range, for example “12 dB” (the default), meaning the graph runs from -12 to +12 dB. Click it to choose 3 dB, 6 dB, 9 dB, 12 dB, 18 dB or 24 dB. This only changes the view, never the sound. When a band you drag reaches the top or bottom of the graph, the range grows so the band stays in view.
Hover readout
As you move the pointer over the graph, the Hz ruler shows the exact frequency under the pointer, or a note name with cents when the Piano Roll is on.
Curves and fills
The graph draws one EQ curve for each channel that has active bands, using that channel’s colour (see Stereo placement). Each band also shades its own area in its colour, brightest when selected.
Tips
- Zoom into the low end for finer frequency placement of a Low Cut or bands on kick and bass.
- Set the gain display range to 3 dB or 6 dB to see small gain changes at a larger scale.