Spectrum analyzer
The real-time spectrum analyzer runs behind the EQ curves. Pre shows the plugin’s input; Post shows its output. Compare the traces to inspect frequency content and processing changes.
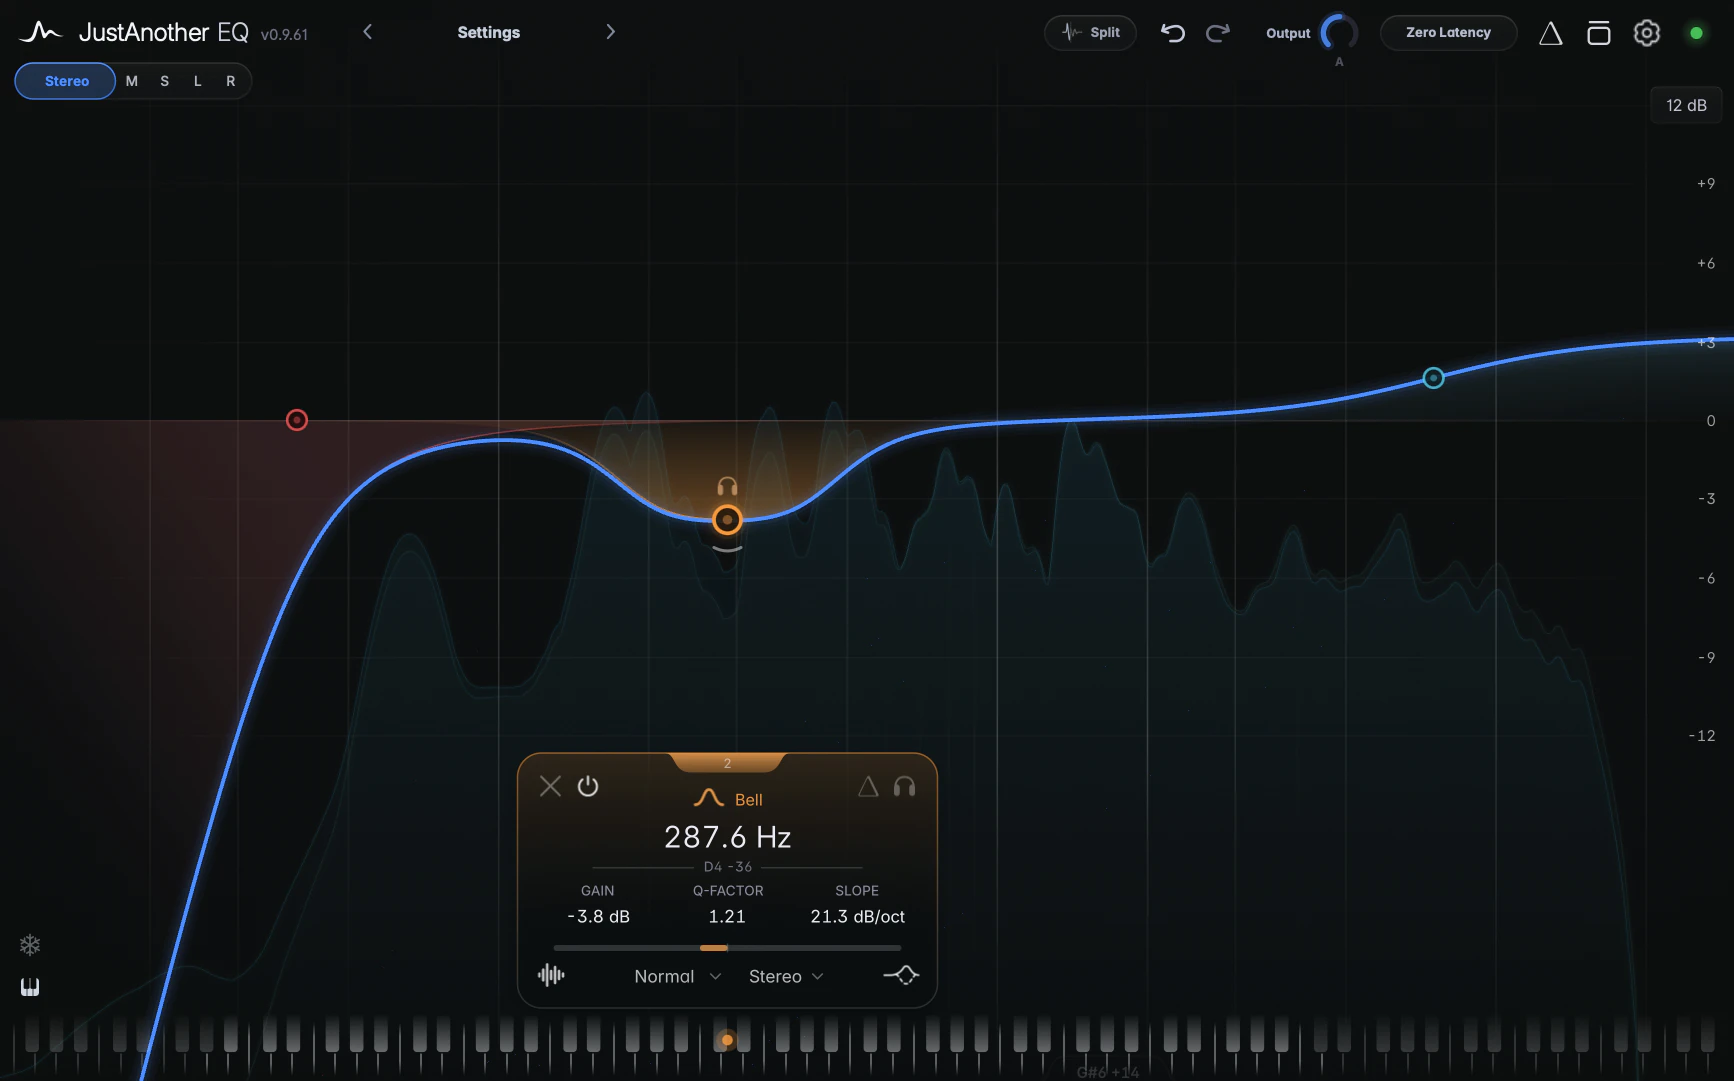
Pre and Post
- Pre is the input, before any processing. It’s delayed to line up in time with Post, for example in Linear Phase mode.
- Post is the final output, after every stage, including any Solo or Delta. It shows what you hear.
The analyzer follows the Channel Focus bar in the header, so it shows the Stereo mix, Mid, Side, Left or Right. Outside the Stereo view the traces take that channel’s colour; in Stereo they’re teal.
Analyzer settings
The ANALYZER column of Settings (the gear icon) holds:
- Pre and Post: switch each trace on or off. A trace that’s off isn’t computed at all, which saves a little CPU.
- Speed (Slow, Medium, Fast; default Medium): how quickly the trace falls after a peak. Slow gives a calmer picture, Fast shows every movement.
- Tilt (0, 1.5, 3, 4.5 or 6 dB/oct; default 4.5 dB/oct): tilts the display around 1 kHz, so the naturally weaker top end of most music doesn’t sit far below everything else.
- Range (60, 90 or 120 dB; default 90 dB): the vertical span.
- Visibility (20 to 200 %, default 100 %): makes the traces fainter or stronger.
Analyzer resolution is fixed and tuned to retain narrow high-frequency resonances.
Reading the level
The top edge of the window is 0 dBFS and the bottom edge is minus the Range setting. The dB labels at the right edge of the graph belong to the EQ curve, not the analyzer. With Tilt on, the trace is deliberately sloped, so use the analyzer to compare frequencies and see changes rather than to read absolute levels.
Freeze
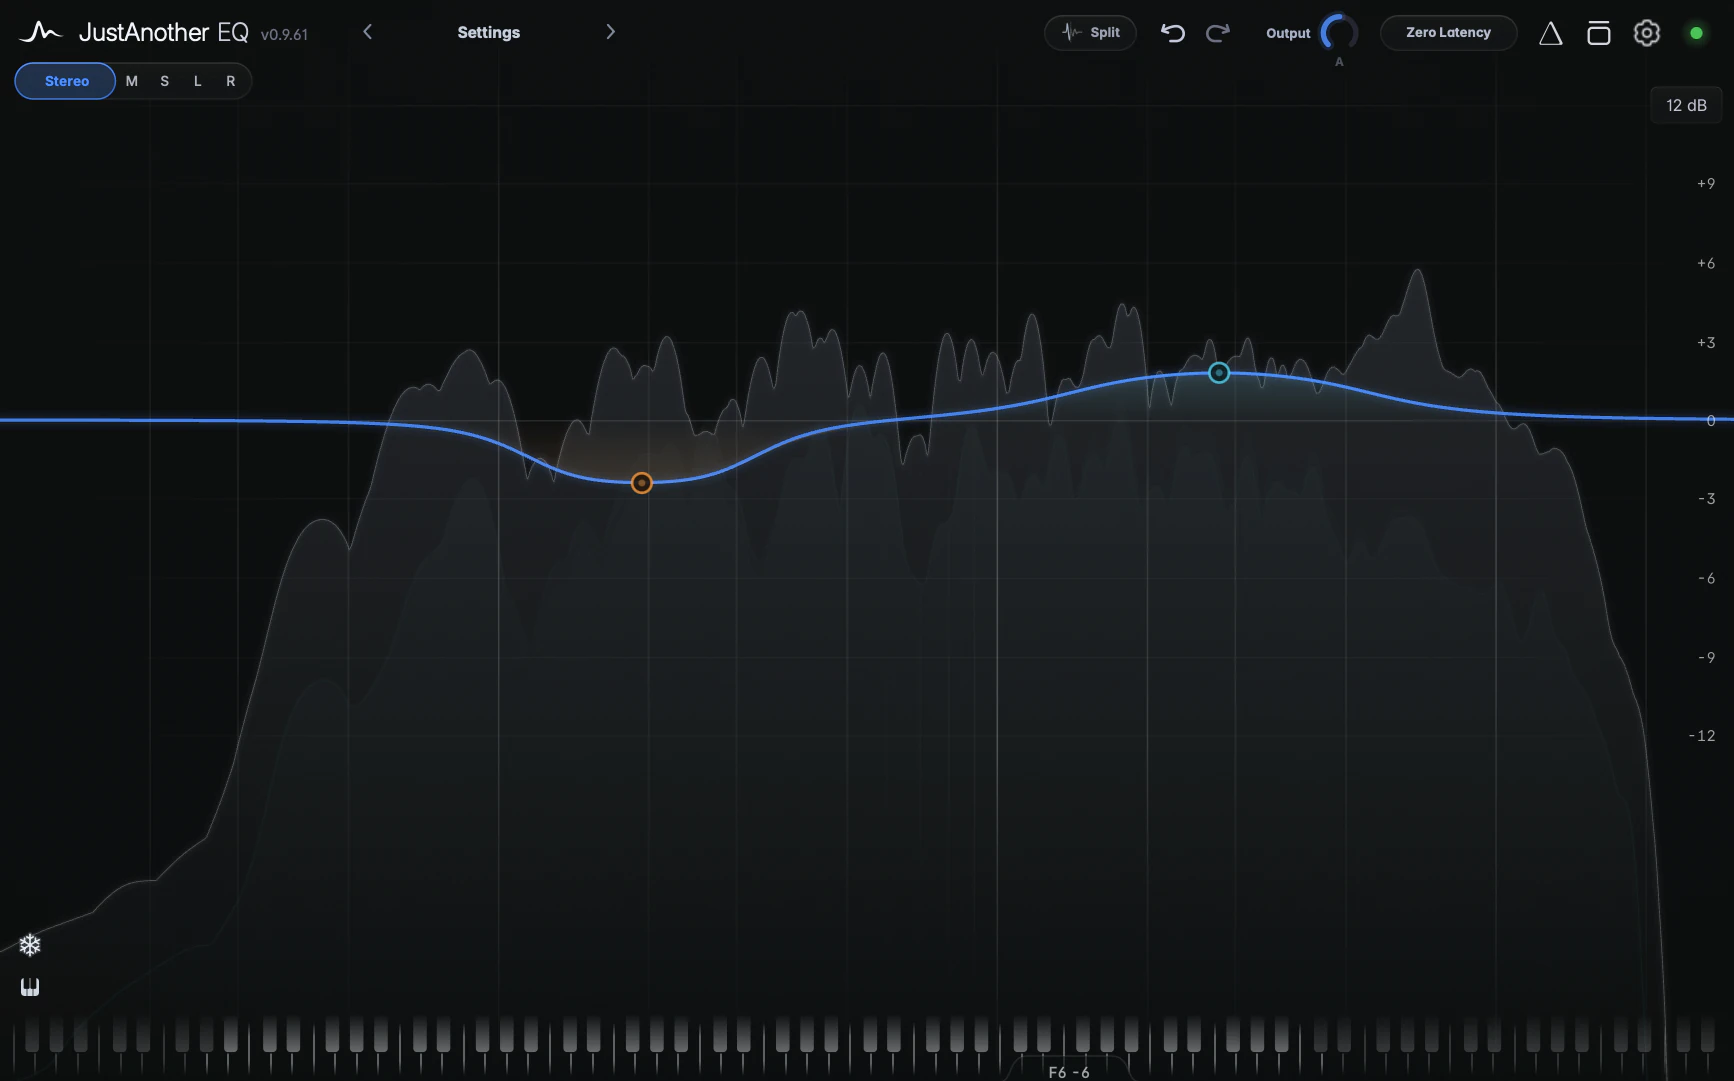
Click the snowflake icon at the bottom left of the graph to freeze the analyzer, or hold Shift with the pointer in the analyzer’s filled area for a momentary freeze. Freeze holds the loudest level the Post trace reaches at every frequency, while the live traces keep moving underneath.
Tips
- Latch Freeze and play a whole chorus: the held shape shows the section’s peak spectrum, so resonances that only show up now and then stand out clearly.
- Switch Pre off when you only care about the result; the single Post trace is drawn brighter.